Fixes and improvements
Smaller changes that shipped alongside today's releases.
Charts
- Profit and loss lines stay smooth through zero.
ProfitLossLinenow draws one continuous line, coloured above and below zero, so smooth curves no longer kink where the value changes sign. The examples usecurveMonotoneX, faded edges and a dashed zero line. - Dragging no longer selects text. Drawing a range selection across a time-series chart doesn't highlight the tooltip or nearby text any more.
- Stacked bars on two axes fit their totals. A stacked
SeriesBardomain now reaches the top of the stack, not the tallest single segment.
New defaults
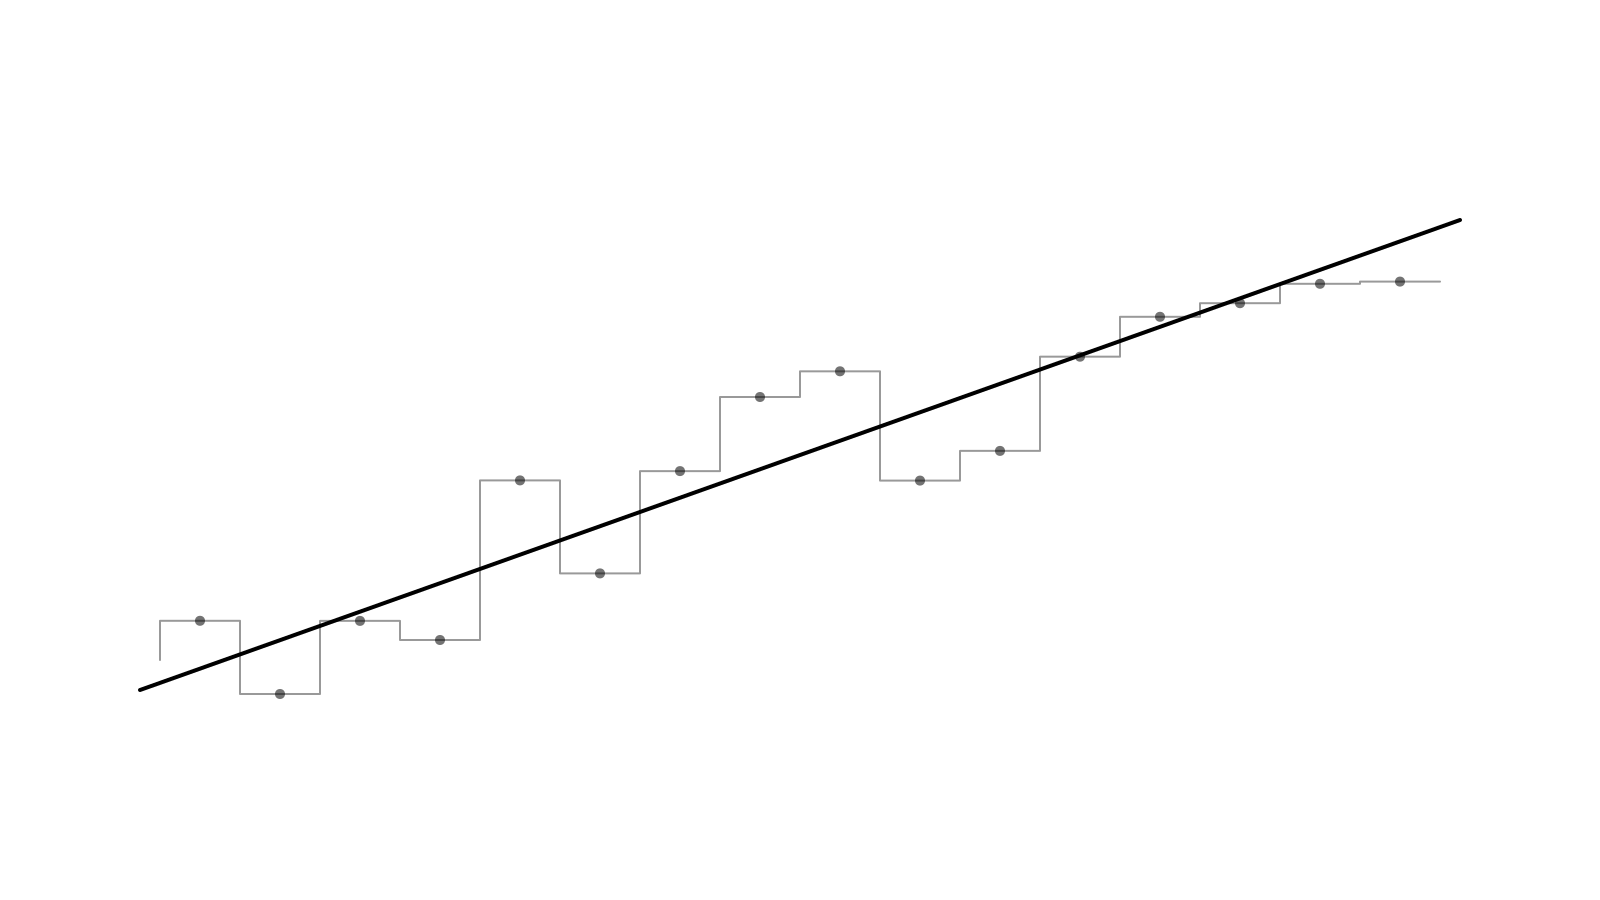
LineSeriesTerminalMarker now fills its dot with the stroke colour, so a projection starts from a dot inside its ring instead of a bare ring. Pass fill="transparent" to keep the hollow marker.
Docs and site
- The homepage area chart plays a short demo: a cursor hovers a marker, then drags out a range selection, tinted green or red by its trend with the % change above it. The demo pauses while you use the chart and is skipped if you prefer reduced motion.
- A new React Native guide, marked Beta in the sidebar.
See the profit and loss line docs and the projection line docs.