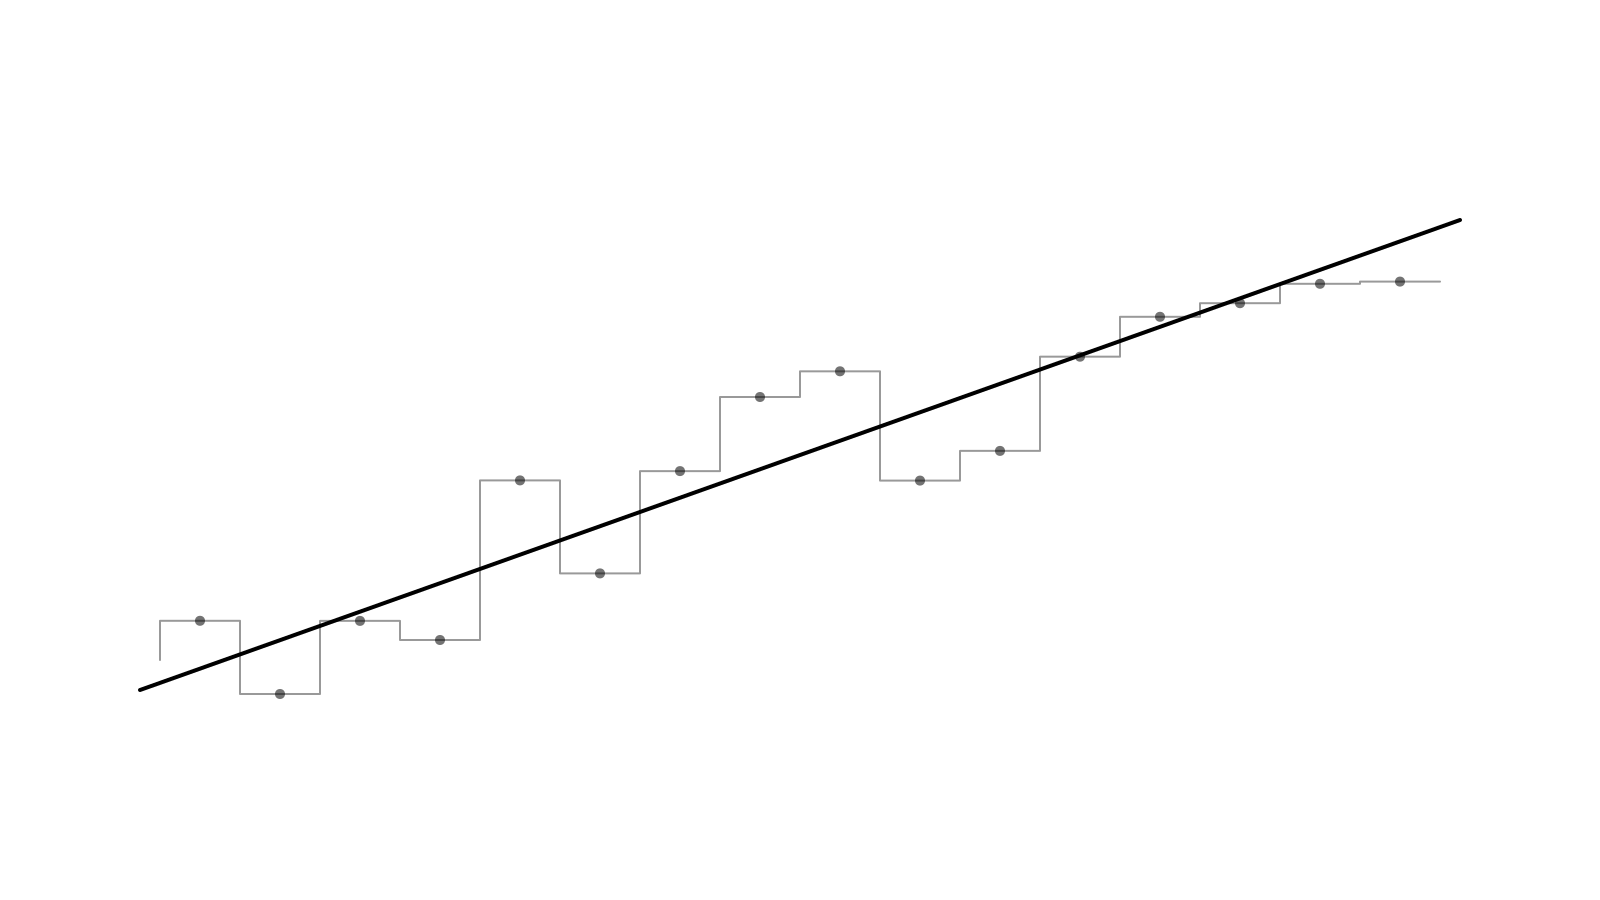
Composed charts
ComposedChart now composes every time-series mark. Alongside Line, Area and SeriesBar, you can drop in Scatter, Candlestick and ProfitLossLine, even inside fragments, and they share the y-domain and the tooltip.
Two axes that stay out of each other's way
Each series picks an axis with yAxisId. The new yDomains prop overrides any axis's domain, either with a fixed [min, max] or with a function of the automatic one. That's how a price and volume chart keeps the volume bars in the bottom quarter while the candles float above. Candlestick works outside CandlestickChart now, sized with widthRatio, and its axis floats around the wicks instead of starting at zero.
Loading and transitions
Composed charts take the same lifecycle props as LineChart: status and loadingLabel for the loading state, xDomain, and the animated y-domain when data changes.
Gallery, Studio and recipes
The composed chart gallery has a new featured chart and six mixed-series variants, from price and volume to forecast bands and P&L with trades. In Studio, each series gets a Type control (bar, line, area, area and line, or scatter), plus Stacked and Gap. A new Combos section in Recipes collects four ready-made mixes.
See the composed chart docs.