Changelog

New charts, primitives and fixes shipped to Bklit UI.

Choropleth camera and dot maps

A world map is good at showing where things are, but on a dashboard it tends to sit there flat. ChoroplethChart now has a camera: click a country and the map flies to it, leaning toward that side of the world, then flies back when you're done.

Click to zoom

Add clickToZoom and clicking a region frames its largest landmass, so France frames France rather than French Guiana. Click it again, click the empty map or press Escape to fly back. zoomTransition sets the duration and curve, and focusMaxZoom caps how far in it goes. While you're zoomed in, only the focused region reacts to hover, so its neighbours don't pull your attention away.

A 3D camera

perspective gives the map one view for the overview and one for a focused region. Each view sets a side (flat, west or east), a yaw and a tilt. With view: "auto" on the focus, the camera turns toward whichever side of the map you clicked. With view: "pointer" on the overview, the map swings from a west view to an east view as the pointer crosses it. Both angles move in the same eased flight as the zoom.

Dots, markers and backgrounds

ChoroplethDotGrid draws the whole map as one hex or square lattice. Dots are never cut at coastlines, the grid can continue over the oceans, and it fades out toward the edges. As the camera zooms in, the dots grow and the ocean dots fade away.

ChoroplethMarker places a circle, triangle, square, diamond or pin at a longitude and latitude, with an optional pulse, glow and stroke. Markers keep their size while the map zooms. ChoroplethBackground puts the line chart's pattern background behind the map, where it stays still while the map moves.

Every option is in Studio, and there are two new map recipes on /recipes.

See the choropleth chart docs.
Gauge dials

A row of notches covers a progress meter. A speedometer, a fan duty readout or a throughput dial needs more: a scale, a pointer and a red line. Gauge now has dial layers you can stack on any arc gauge, and it sizes them for you.

Layers that compose

Each layer is one prop. Pass true for the default look or an object to tune it.

  • arcStyle draws the track as notches (the default), one solid stroke, or none, so a sector or ring can carry the value on its own.
  • ruler adds ticks inside or outside the track. Ticks brighten as the fill passes them. Labels can show every major tick or just the two ends, in your own units: labels: { min: 0, max: 800 }.
  • needle comes as line, gradient, triangle or polygon. tip stops it inside the track, at its outer edge, or past the outermost layer.
  • zones marks ranges such as a red line. Show them as a thin band, as a colour change in the fill (zoneDisplay="fill"), or both.
  • sector fills the wedge up to the value with a conic or radial gradient, a flat colour or a pattern.
  • progressRing, dots, glow and centerDisc add a value ring, rings of dots that light up, a soft bloom and a disc behind the label.

Rings, zone bands and an outside ruler take space from the outside in, and the track shrinks to fit. Stack them without tuning any radii.

A sweep instead of a bounce

The enter animation is new. The track fades in, then the fill, the needle, the sector, the ring and the dots sweep together from zero to the value on a spring with no bounce. When value changes, the sweep carries on from where it is and keeps its speed. Use enterTransition to change the timing. With reduced motion on, the gauge appears at its value straight away.

Six new recipes

A dashboard dial, a speedometer, a conic sector KPI dial, a solid fan duty gauge, a progress dots uptime gauge and a live load dial are ready to copy from Recipes.

See the gauge docs for every option.

Present and export

Want a chart for a post, a slide or a design review? Every example on Charts and every recipe now has a Present chart button. It opens the chart in a modal and plays its entrance again, with a floating toolbar like the one in Studio.

Export a PNG

Pick Square (1080×1080) or Portrait (1080×1350). Exports render at 2x on a black background, with padding around the chart and a faint pattern tinted to the current palette that fades out toward the edges. The toolbar sets the padding, chart size, chart aspect and pattern opacity, and turns the legend on or off. It follows the colour palette picked in the site header.

Press E to export without leaving the chart. If you're hovering a point, the tooltip stays in the image.

Edit the data

Click Edit data to open the chart's data as JSON in a side sheet. Change a value and the chart redraws in place, so you can try your own numbers before you install anything. This works on 217 of the 228 chart examples and on every recipe chart. The live line chart is left out on purpose because it streams its own data.

The editor only exists on the site. The code you install with the shadcn CLI is unchanged.

Open Charts or Recipes and try it on any example.

Fixes and improvements

Smaller changes that shipped alongside today's releases.

Charts

  • Heatmaps sweep in column by column. Cells now enter from left to right in a wave on the same curve as the line chart reveal. Each cell fades in, rises a little and scales up. animationDuration now defaults to 1100 ms (it was 1600). The new enterTransition and enterStaggerScale props change the timing.
  • Replaying a heatmap no longer shifts the page. Replaying the entrance used to push the layout down by up to 263px. It now stays still.
  • Funnel charts size correctly when scaled. A funnel inside a scaled container, such as the new present view, now measures itself correctly.
  • The sunburst legend example shows its items. It used to render an empty legend.
  • Radial dot-bar examples no longer freeze. An infinite update loop is fixed.

Docs and site

  • The Recipes page button now shows how many recipes there are: Browse N recipes.
  • Band, Weekends, Trend Line and Deadline no longer carry a "New" badge in the nav.

See the heatmap docs for the new animation props.

React Native charts

Bklit charts now run in React Native. The line and area charts use the same components and props as on the web, LineChart, Line, Grid, XAxis, ChartTooltip, but draw with React Native Skia and animate with Reanimated, so scrubbing, springs and data changes run on the UI thread at full frame rate.

Built for touch

Drag sideways across a chart to scrub: the crosshair, dots and tooltip follow your finger with the same springs as the web, and the date pill under the axis rolls month and day like a counter. Put two fingers on the chart to select a range, tinted by its trend, with the % change pinned above it. Vertical drags still scroll the page, and onActiveIndexChange gives you a hook for haptics.

The same recipes

Faded edges, highlight while scrubbing, pattern fills and backgrounds, bands, reference areas, trend lines, dashed forecasts, profit and loss lines, weekend stripes and event markers all come across. Changing the data morphs the chart, and changing the range zooms it instead of jumping.

Try it, then install it

Install the demo app from the React Native guide: scan the QR code on Android, or join the TestFlight beta on iPhone once it's live. When you're ready, add the charts to an Expo app with one command. The CLI installs Skia, Reanimated and Gesture Handler with npx expo install, so you get versions that match your SDK:

npx shadcn@latest add @bklit/native-charts

This is a beta: it's tested on iPhone with Expo SDK 58, and Android reports are welcome. See the React Native guide for setup, compatibility and the full component list.

Pattern presets

Patterns get a new set of presets, and pattern fills can now fade like solid ones. There are 29 presets, adapted from Nucleo's free SVG patterns: lines, grids, dashes, dots, circles and checkerboards, each with -sparse and -dense variants. Every preset is stored as its smallest repeating cell, so the whole set weighs about 2.5 KB.

One component for every preset

Add a PatternPreset with an id, then point any fill at it with url(#id). Components with a built-in pattern prop, such as Background, Band, ReferenceArea and Weekends, take a preset id directly. Need something else? PatternTile draws your own square tile. The old ids still work: diagonal and accent map to diagonal-up, and cross maps to grid.

Fades for pattern fills

PatternArea now takes fillOpacity, fadeEdges and fadeBottom, so a hatched area can fade into the edges of the chart the same way a gradient does. fadeEdges on Area and Line also accepts { left, right } in percent, so each side can fade by a different amount.

In Studio

The pattern picker shows real swatches grouped by family. Solid and pattern fills share one set of Opacity, Fade left, Fade right and Fade bottom sliders, and every pattern has a Scale control. Old share links still open.

See every preset on the Patterns page.

Composed charts

ComposedChart now composes every time-series mark. Alongside Line, Area and SeriesBar, you can drop in Scatter, Candlestick and ProfitLossLine, even inside fragments, and they share the y-domain and the tooltip.

Two axes that stay out of each other's way

Each series picks an axis with yAxisId. The new yDomains prop overrides any axis's domain, either with a fixed [min, max] or with a function of the automatic one. That's how a price and volume chart keeps the volume bars in the bottom quarter while the candles float above. Candlestick works outside CandlestickChart now, sized with widthRatio, and its axis floats around the wicks instead of starting at zero.

Loading and transitions

Composed charts take the same lifecycle props as LineChart: status and loadingLabel for the loading state, xDomain, and the animated y-domain when data changes.

The composed chart gallery has a new featured chart and six mixed-series variants, from price and volume to forecast bands and P&L with trades. In Studio, each series gets a Type control (bar, line, area, area and line, or scatter), plus Stacked and Gap. A new Combos section in Recipes collects four ready-made mixes.

See the composed chart docs.

Fixes and improvements

Smaller changes that shipped alongside today's releases.

Charts

  • Profit and loss lines stay smooth through zero. ProfitLossLine now draws one continuous line, coloured above and below zero, so smooth curves no longer kink where the value changes sign. The examples use curveMonotoneX, faded edges and a dashed zero line.
  • Dragging no longer selects text. Drawing a range selection across a time-series chart doesn't highlight the tooltip or nearby text any more.
  • Stacked bars on two axes fit their totals. A stacked SeriesBar domain now reaches the top of the stack, not the tallest single segment.

New defaults

LineSeriesTerminalMarker now fills its dot with the stroke colour, so a projection starts from a dot inside its ring instead of a bare ring. Pass fill="transparent" to keep the hollow marker.

Docs and site

  • The homepage area chart plays a short demo: a cursor hovers a marker, then drags out a range selection, tinted green or red by its trend with the % change above it. The demo pauses while you use the chart and is skipped if you prefer reduced motion.
  • A new React Native guide, marked Beta in the sidebar.

See the profit and loss line docs and the projection line docs.

Bklit is now built on d3

Every chart in Bklit used to sit on visx, a set of React wrappers around d3. The charts now use d3 directly, with small Bklit-owned components for the parts visx used to render. You get a lighter install and a smaller bundle, and your charts look and move exactly as before.

Fewer packages

The 13 @visx/* packages and @use-gesture are gone, and so is react-use-measure. Together with the duplicate d3 copies and types they pulled in, that's 28 fewer packages in the repo's lockfile. Installing the chart library's dependencies now pulls 40 packages instead of 80, about 3 MB less on disk. A chart's registry item now lists only the d3 modules it uses, such as d3-shape and d3-scale.

The tooltip no longer needs a measuring library to adapt to its content: when the rows change, the panel now springs to its new size with Motion, keeping text crisp and the panel in place. Set animateSize={false} on ChartTooltip to turn it off; it is also off under reduced motion.

Smaller and faster

Every chart ships less JavaScript (gzipped, React and Motion excluded):

ChartBeforeAfterChange
Choropleth44.4 KB27.2 KB−38.6%
Sankey24.6 KB16.6 KB−32.6%
Area with brush59.5 KB50.7 KB−14.7%
Bar42.2 KB36.2 KB−14.4%
Pie15.4 KB13.6 KB−11.4%
Line58.1 KB53.3 KB−8.3%
Whole library207.6 KB188.8 KB−9.0%

Choropleth maps project their first render about 2.8× faster (34 ms → 12 ms for the world map) and no longer reproject when they re-render with the same data. Line and area paths are memoized, so a 200-point line re-renders about 16× faster when only hover or styling changes; animated data transitions still redraw every frame. Timings are relative, measured in Node.

Nothing to relearn

Props, markup, animations and hover behaviour are unchanged. Before each step of the move, 357 recorded chart variants were compared against the old visx output, covering geometry, text, hover and interactions, and every one matched.

Breaking changes

These only affect you if you installed components from the registry and edited or imported their internals:

  • Curves import from d3-shape instead of @visx/curve, for example import { curveMonotoneX } from "d3-shape".
  • Gradients: LinearGradient, RadialGradient and the gradient presets are now Bklit components (@bklit/gradients) with the same API.
  • Class names: lines, areas, grid and heatmap no longer render visx-* class names. If you styled them, target your own className instead. The brush keeps its visx-brush-* classes.
  • Choropleth: TransformMatrix is now a local type with the same shape.

To update installed charts, follow Upgrading from visx. It includes a prompt you can paste into your coding agent.

Sparklines

A KPI card needs a trend, not a chart: no axes, no grid, no tooltip, and it has to stay cheap when there are fifty of them on the page. LineSparkline, AreaSparkline and BarSparkline are built for exactly that. Pass data and a dataKey and they fill their parent at 32px tall.

Built for density

Each sparkline renders a single <path>, bars included. Every responsive sparkline on the page shares one ResizeObserver, and passing a fixed width skips measuring entirely. Only the hovered instance re-renders, so a grid of 200 stays smooth.

Enter animations, on by default

Animations run on the Web Animations API instead of React state. Lines draw in along their stroke, areas wipe in and bars grow from the baseline. Tune them with animationDuration and animationEasing, or pass animate={false}. With reduced motion turned on, each one becomes a short fade.

Hover without a tooltip

A crosshair and a dot follow the nearest point. The crosshair is "dashed" by default; choose "solid", "gradient" or false. There's no tooltip on purpose. Use useSparklineHover to read the hovered datum and show it wherever you like, such as the big number on the card. Spread its sparklineProps onto several sparklines and their crosshairs move together.

Everywhere you look

  • Gallery and Studio: browse them at /charts/sparkline and try every prop in Studio.
  • Recipes and blocks: a new KPI sparklines recipe joins the recipes, and the quiet-sparkline recipe and stat-card blocks now use the new components.
  • Installing: add them with the sparkline shadcn item.
  • Migrating: the migrate skill now maps Recharts Tiny charts and TanStack Charts sparklines to these components.

See the sparkline docs for every prop.

Recipes

The hardest part of a good chart is rarely the data — it's the look. Recipes is a gallery of finished treatments you can lift straight into your app: faded pattern backgrounds, squircle bars, custom hover indicators, event markers, forecasts, range bands, heatmap and donut styles.

One look, every chart

Pick a recipe, then switch between the charts it applies to. Each one shows the exact code for that chart, so you are never translating a bar-chart example into an area chart by hand.

Prompts for your agent

Every recipe ships with a prompt written for the Bklit UI agent skills — per chart, or for all charts at once. Paste it into your coding agent and it applies the treatment to the charts already in your codebase, using the right components and props.

Studio, tidied up

Layer visibility now works across every chart in Studio: toggling a layer's eye hides it in the preview, whichever chart you're editing. Settings that silently did nothing are either wired up or gone, and the palette switcher animates between its list and customise views.

Recipes replaces Blocks in the site navigation. The Blocks page is still there.

Smart value labels

Sometimes a tooltip is one interaction too many. Area and bar charts can now print their values directly on the chart — turn it on with showValue and the chart decides where each label can go. Anything that would collide or overflow is hidden rather than clipped.

Bars

A bar label appears only when it fits inside its bar. By default the chart tries horizontal text first, rotates it when vertical text fits better, and hides it when neither does. You can lock the orientation, and move the label to the top, centre or base of the bar.

Areas

Area labels sit above a sample of points rather than every one, so the line stays readable. Stacked series share one label count so their labels line up, and you can set a minimum and maximum per series.

Built to resize

Every fit check re-runs as the chart changes size. A dense chart shows fewer labels on a phone than on a laptop — never overlapping, never cut off. Numbers default to English digits; pass valueLabelFormatter for currency or localised output.

Studio has controls for all of it, and they carry through to the generated code. See the bar chart and area chart docs.

Tooltips, rebuilt

Tooltips are the part of a chart people touch most, so this week they got the most attention.

A panel that matches your app

The panel now looks like the popovers in shadcn and coss ui: a rounded frame with a hairline border, a soft shadow, and a header row separated from the values. Series get small colour dots, labels are muted, and values are right-aligned in tabular figures so columns of numbers line up. Its colours come from your popover tokens, so it follows your theme without extra setup. Building custom tooltip content? The new TooltipHeader gives you the same header.

Hover dots with a halo

The default hover dot is now a solid core inside a soft halo of the same colour. Both spring open when you hover and follow the tooltip as you move. Tune them with dotHaloScale and dotHaloOpacity.

Motion that feels connected

  • Every tooltip fades out when the pointer leaves, instead of vanishing. Pass exit={false} for the old behaviour.
  • Heatmap tooltips spring from cell to cell like the other charts instead of snapping.
  • Jittered scatter tooltips sit beside the point you are on and spring to the other side when they run out of room, rather than pinning to the top of the plot.
  • Reduced motion is respected: the panel jumps into place and keeps only a short fade.

Bar charts lose the crosshair

A vertical crosshair line helps on a line chart and gets in the way on a bar chart. Bar charts now hide it by default; pass showCrosshair to bring it back.

See the Tooltip docs for every option.

Jittered scatter plots

When many rows share the same date, scatter points pile on top of each other and a hundred values look like five. Pass jitter to ScatterChart and they spread out sideways (and optionally vertically) into a strip plot you can actually read.

Deterministic by design

The offsets come from a seeded hash, not Math.random. Points land in the same place on every render and on both the server and the client, so nothing jumps after hydration or when data updates. Change the seed if you'd prefer a different arrangement.

Hover still tells the truth

Hover snaps to the nearest jittered point and the tooltip shows its real values, not the nudged position. The crosshair line is hidden by default for jittered charts, since it would point at a date rather than the point you are on.

New defaults

Scatter now dims inactive points with opacity instead of blur, and drops the ring around each point — a quieter default that reads better in dense plots. To keep the previous look, pass strokeWidth={2} and inactiveMode="blur".

See the scatter chart docs for the full jitter options.

Fixes and improvements

Alongside the bigger releases, a long list of things that now simply work the way you'd expect.

Charts

  • Bar charts handle negative values. The scale always includes zero and bars grow from the zero line in both orientations — profit and loss charts now just work.
  • Stacked horizontal bars draw every segment at the right width and grow from their own position instead of overlapping while they animate.
  • Line charts morph smoothly when their data changes, rather than snapping to the new values.
  • Markers and edge points are no longer clipped at the edge of the plot.
  • Ring charts no longer flicker when you hover near the inner edge of a ring.
  • Custom PieCenter content shows at rest, not only while hovering a slice.
  • Persian, Arabic and Hebrew labels animate as a single run so letters stay joined and in order, and the date ticker only scrolls the part of the date that changed.

Installing with shadcn

  • Charts installed from the registry keep their imports valid in your project's folder layout.
  • Theme tokens map correctly into your @theme variables.
  • Every chart passes the React Compiler lint rules.

Docs and site

  • A new Markers page, and an up-to-date Theming guide.
  • "New" badges in the sidebar and mobile menu, which now share one navigation.
  • Better page titles, social cards and structured data across the site.

Multi-hue palettes, Weekends and Deadline

Palettes

Charts now default to a primary palette — indigo, yellow, fuchsia, mist and black-and-white — and come with a set of curated multi-hue palettes shared by the docs and Studio. Pick one from the palette menu, fine-tune any colour with the Studio colour picker, and export the result as CSS variables.

Trend charts get semantic --chart-positive and --chart-negative tokens, so gains and losses stay meaningful in any palette. The heatmap scale now derives from your first chart colour.

Weekends and Deadline

Two small primitives that make time-series charts easier to read at a glance. Weekends shades weekend days behind the series, with stripes or a solid fill. Deadline marks a due date with a line and a fading region after it — striped, gradient or solid.

A faster chart catalogue

/charts has been rebuilt around a sticky sidebar that tracks where you are and links straight to any variation. Charts only mount as they scroll into view, so the page stays fast however many examples it holds.

Read more in the Weekends and Deadline docs.

Band and TrendLine

Two new layers for showing what's around and underneath your data.

Band

Band fills the space between an upper and a lower value — confidence intervals, min–max ranges, forecasts. Fill it solid, with a gradient or with a pattern, style each edge on its own, and fade any of its four sides. It draws in with the line it sits behind.

Bands also work on their own as range areas. The tooltip shows each band's low–high range with a dot on both edges, and the chart's scale fits the bands even when there's no line. For finance charts, withBollingerBands works the bands out for you.

TrendLine

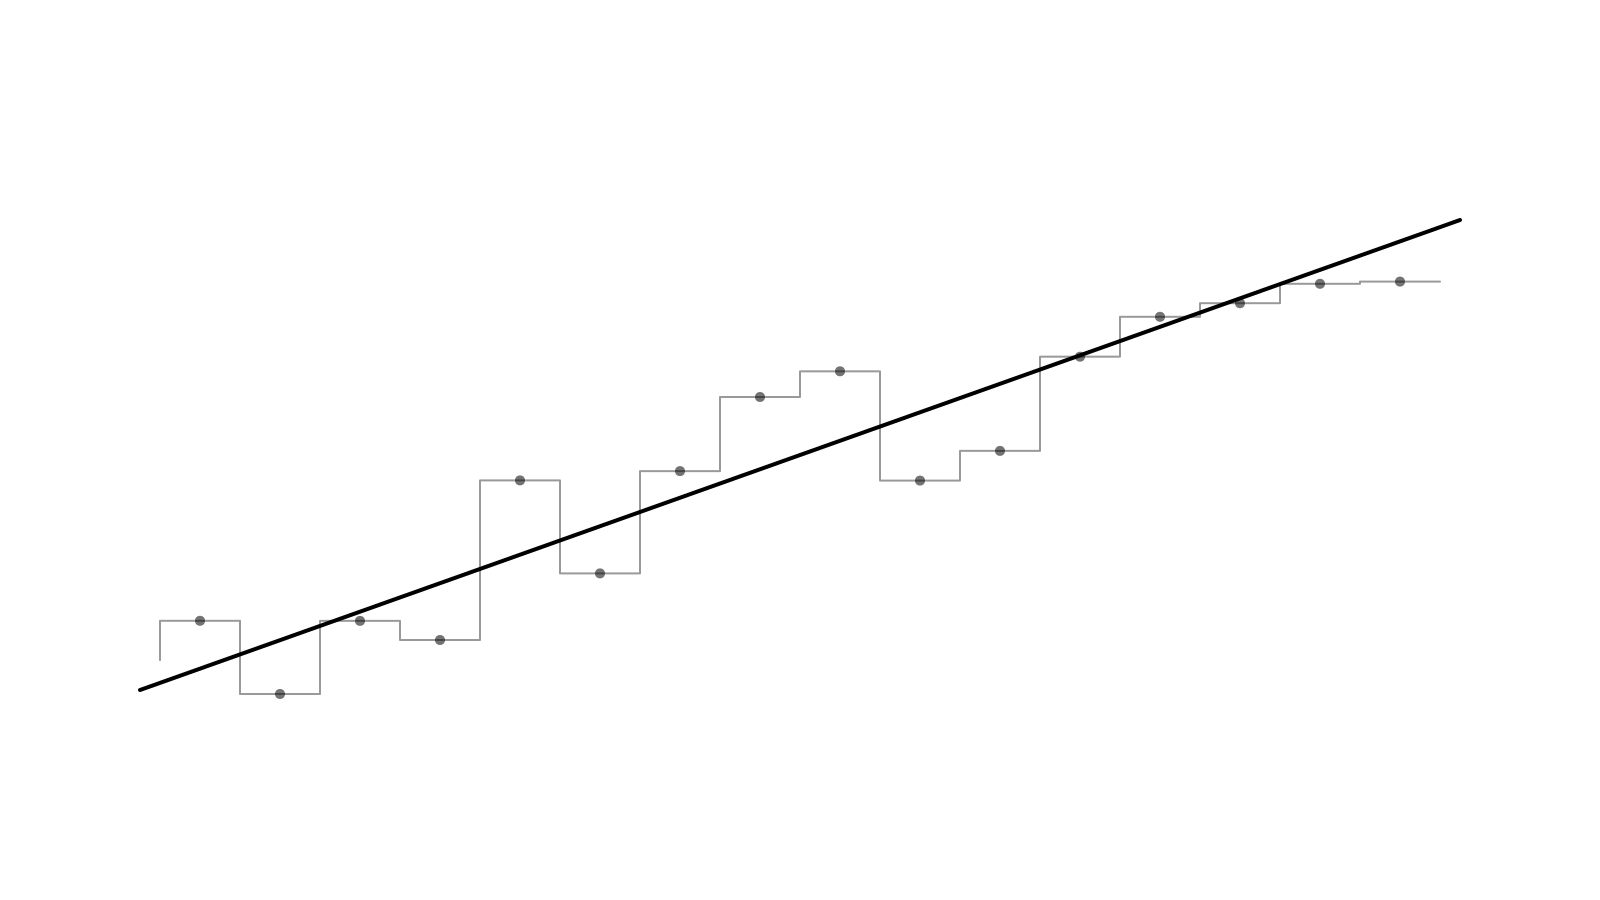
A stepped line with a straight line running through it

TrendLine draws the straight line of best fit through a series, so the direction of noisy data is obvious at a glance. Make it solid, dashed or a gradient, with optional faded ends. It works in line, area and composed charts, and in bar charts in either orientation.

Both are layers in Studio. See the Band and TrendLine docs.

A new look, built on coss ui

Bklit UI has a new home. The site, docs and Studio now use coss ui components and its colour palette in place of our shadcn primitives.

Frames and rails

Pages sit between two thin rails that now run all the way up through the header, with small square rivets where section dividers meet them. Docs pages sit in frames on a tinted canvas, and every component has its own illustration.

Cal Sans

Headings and body text now use Cal Sans, the same typeface as coss ui, for a tighter and friendlier voice.

A simpler homepage

The homepage hero has been pared back, and the community showcase has moved to its own Showcase page.

Studio keeps its square, tool-like chrome. The navigation and every URL stay the same.

Chart benchmarks, in your browser

Performance claims are easy to make and hard to check. Benchmarks lets you check ours: it runs Bklit UI, Recharts and TanStack Charts against the same seeded data — line, area, bar and scatter — in your own browser.

What it measures

Each run reports how long a chart takes to mount, to update and to respond to hover, how many DOM nodes it creates, and how much it adds to your bundle, then combines them into a score. Enter animations are timed for reference but never scored, so no library is penalised for animating.

Smaller tooltip dates

Building it, we also made the tooltip's date pill fit its label: it measures the current date and springs its width as you move, instead of sizing itself to the longest month.

Agent skills for design and migration

Bklit UI ships agent skills — instructions your coding agent loads so it uses the right components and props instead of guessing. Two new ones join the core skill.

npx skills add bklit/bklit-ui

bklit-ui-design

Describe the look you want in plain words — "faded pattern background", "squircle bars", "3D glass bars", "hatched area", "skeleton loading", "match our brand" — and the agent maps it to real Bklit components and props. It checks your Tailwind version, colour format, dark mode and corner radius first, so the result fits your app.

bklit-ui-migrate

Point your agent at a codebase using Recharts, directly or through shadcn's chart component. It finds every chart, sorts them into ones that convert cleanly, ones that need a workaround, and ones to leave on Recharts, then converts them to Bklit UI and checks the result.

The core bklit-ui skill has been rewritten alongside them.